

Analytics capabilities are becoming increasingly important in both consumer and enterprise applications. There is no doubt that analytics can help you grow and succeed. Integrating analytics into your product can result in the addition of new revenue streams. You can use data or analytics to identify upsell opportunities. You might even consider offering it as a completely new feature set or product line.
We want to demonstrate how to de-risk your embedded analytics journey in this article. The few items outlined here will get you started and provide you with some critical points to consider, ensuring your success with your Tableau embedded analytics project.
- What is Tableau embedded analytics?
- How to Be Successful With Tableau Embedded Analytics
- 1. Tableau embedded analytics dashboards user experience
- 2. Establish common language in your Tableau embedded analytics
- 3. What do users want to see on your tableau embedded analytics?
- 4. Match the current processes and mental models your users
- 5. Understand the behavior you want to change with the embedded analytics
- Implementing Embedded Analytics with Tableau Step-By-Step
- Embedding Tableau in the web portals - advanced features
- Conclusion
What is Tableau embedded analytics?
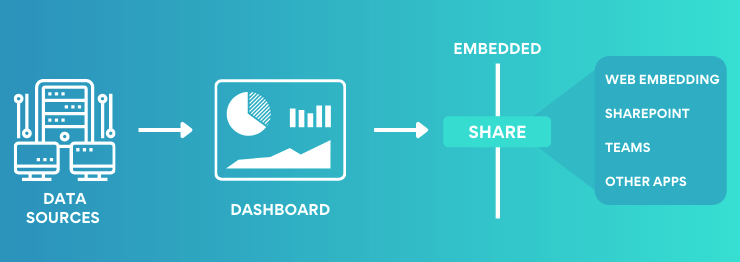
Tableau is a leader in the embedded analytics market following enhancements to the embeddable analytics and visualizations on the BI/analytics platform in recent years.
Tableau provides rich visualizations and dashboards that make data-driven insights easily digestible. Intuitive UI that enables users to leverage their data through a variety of no-code features, like drag-and-drop interactive visualizations design, visual data preparation, natural language queries, and single-click AI-driven statistical modeling.
You can easily embed Tableau dashboards in their applications, delivering insights with prebuilt KPIs and drill-down capabilities for faceted data visualizations. This can not only accelerate time to market but also keep your team focused on delivering your product to customers.
Embedded Analytics benefits
Tableau embed code allows you to deploy and integrate Tableau into your infrastructure, regardless of whether it is on-premises or in the cloud. Additionally, Tableau comes pre-configured with native connectors to hundreds of data sources.
Reduced the time and effort Build powerful Tableau dashboards in days, instead of weeks. Tableau embedded analytics is a cost-effective solution that allows you to focus on building your product, saving you time, resources, and money.
Versatile data sources. Tableau can connect to all the popular data sources like: flat files (i.e. spreadsheets), databases (i.e. PostgreSQL, SQL Server), cloud systems (i.e. AWS Redshift, Google BigQuery), and more.
Integrations with existing authentication infrastructure enable you to grant access to data while reusing existing authentication infrastructure. Create dashboards once and then load filtered data according to each user's permissions using row-level security and user filtering. Utilize the REST API to manage users and content at scale.

How to Be Successful With Tableau Embedded Analytics
There are numerous opportunities for Tableau embedded analytics to help create impactful products, but it is our responsibility to ensure that our clients receive a product that does the job correctly. The following are five factors that will ensure the failure of your Tableau embedded analytics project. Ascertain that they do not.
Tableau embedded analytics dashboards user experience
A poor visual design will almost certainly sink any embedded analytics solution, even if everything else is perfect. There are numerous ways to muddle dashboards to the point where your tableau embedded analytics put users off.
Solution:
Complexity and clutter are two of the most powerful adversaries of effective data visualization design. Everyone wants to cram as much information as possible into their dashboard in order to avoid leaving anything out:
put the most important parts the largest, Highlight them, put them front and center
remove everything that isn’t the most important insight
Establish common language in your Tableau embedded analytics
One of the first steps toward implementing successful Tableau embedded analytics is to understand how the business describes its work, its objectives, and the metrics it uses to measure it. Bear in mind that even within the same company, the terms used to describe the same thing can vary.
Solution:
Conduct interviews with business executives, managers, and front-line salespeople to establish a naming convention for the terms that will be used to describe specific metrics.
When labeling and titling your Tableau embedded analytics dashboards and charts, use their language, not yours. Then, as you demonstrate the Tableau Embedded Analytics dashboard to them, elicit their interpretations of the words and titles. Always look for better words to convert charts meaning better.
What do users want to see on your tableau embedded analytics?
Your users can not be overwhelmed with data. They need to understand how data can assist them in performing their jobs more effectively. They want to know how they can make a tangible difference. You need to understand the context in which our customers will be viewing the data. With Tableau embedded analytics, the level of sophistication is critical.
Solution:
Maintain a low level of sophistication when demonstrating Tableau embedded analytics to end-users. Provide them with only the information they require to take action or make a strategic decision.
Allow a higher level of sophistication only for analytics for more advanced users, who will be performing data exploration work. Those users want to sift through the data, identify the insights, and verify their validity. Provide them with filters, parameters, and a large amount of data.
Match the current processes and mental models your users
Always keep in mind your users are accustomed to seeing data within the various systems they use, like a marketing automation system or CRM. They're so accustomed to looking at those that they can become reluctant to adopt Tableau embedded analytics just because it looks different.
Solution:
Deploy Tableau embedded analytics consistent with how people are accustomed to consuming data. Mimicking how they are accustomed to viewing and processing data reduces their mental friction.
Plan authentication integration in advance so that the user is not required to log in to yet another system in order to access additional data. This significantly reduces the technical friction associated with your customers' experience.
Understand the behavior you want to change with the embedded analytics
If you want to convince skeptics who are accustomed to making decisions based on gut instinct, you must quantify the success of analytics. Do not be afraid of financial targets.
Solution:
Define the behavior you wish to modify or promote. Connect positive behavior to a positive outcome for the business to gain a better understanding of the business's overall value.
When possible, connect that altered behavior to the amount of revenue or other critical metrics that it will eventually generate. Insights integrated into people's workflows are acted on quickly and easily, resulting in the desired results.
Implementing Embedded Analytics with Tableau Step-By-Step
Select the key data visualizations you will be showing to the users
The traditional IT project management approach, where IT and business leaders meet to define requirements is not efficient for highly visual reporting. This way you can spend weeks trying to transform the business needs into a usable report.
Instead, launch prototypes to drive a fast-paced test-and-learn lean process. Focus on the most important business value that business users want to convey in the data. Let them show you how they want to use the Tableau dashboard.
Only when business users get a chance to use and understand how the analysis works you will uncover all their needs. Indeed, people often can't articulate what they want until they see it.
Identify the key data sources you will be accessing
Data is everywhere. An analyst’s intuition and a subject matter expert’s input will guide you to the right data from the right sources to address and solve your business problem.
Meet with the business users and IT departments to clarify the key source data and plan how to connect to data sources. The most common examples of these are databases, flat files (i.e. spreadsheets), databases (i.e. PostgreSQL, SQL Server), and cloud systems (i.e. AWS Redshift, Google BigQuery). This will allow you to better understand which users own data and plan how to access it in a secure way.
Once the business has defined its data requirements, you can focus on delivering high-quality data while maintaining the highest quality of data security.
Decide where users will be accessing the dashboards
Understand who your target users are as well as their roles and responsibilities. Discuss embedded analytical solutions, accessing the dashboards and usability requirements like toggle sub-navigation.
This will allow you to better plan the embedded solution. We define the security level for each user (or group) and the trusted authentication method, i.e. enable single sign-on.
Applications contain analytics in one or more of the ways shown below. An embedded analytics application can start at any stage in the diagram and progress over time.
| Standalone analytics Analytics is a separate application | Gateway to analytics SSO access from application to analytics | Embedded analytics Analytics appears as submodule | Infused analytics* Analytics integrated with application | |
| Data visualization | ✔ | ✔ | ✔ | ✔ |
| Security | ✔ | ✔ | ✔ | |
| Seamless UX | ✔ | ✔ | ||
| Data workflows | ✔ |
Prepare interactive visualizations using Tableau editor
Interactive data visualization is the process of creating a visual representation of data that can be explored and analyzed directly within the Tableau editor.
Take advantage of the fact that Tableau analytics is designed to deliver interactive visualizations to your users and, if possible, distribute the data across multiple visualizations. Consider your design carefully—the fewer sheets and data sources you use, the faster your visualization will perform.
Embedding Tableau in the web portals - advanced features
Embedding Tableau content enables you to extend the interactive visualization capabilities of external applications. Embedding is frequently used to empower your customers in the following situations:
Embed Tabeau in business applications like CRMs
Integrating interactive visualizations into a public page (i.e. blog post)
While embedding a single dashboard or visualization into a single webpage is straightforward, a well-engineered integration requires managing additional factors such as trusted authentication, authorization, and content management.
Depending on the integration objectives, a variety of features and techniques may be required:
Tableau Embedded Views update as the underlying data changes, or as their workbooks are updated on Tableau Server or Tableau Online. This allows people in your organization to view and interact with Tableau embed code in web pages without having to sign in to the server.
Tableau JavaScript API allows you to respond to events in visualizations, to dynamically load and resize visualizations, to filter the data displayed, select marks that drive parameter changes on other sheets
Tableau Server allows you to manage complex users access rules for Tableau dashboards. You to edit your stories, dashboards, and workbooks and at the same time choose who has access to them and to what extent. It allows for single sign-on through SAML and Active Directory, as well as row-level security.
Conclusion
I hope that this blog has increased your understanding of the Tableau embedding analytics process and demonstrated that taking the first steps toward offering an embedded analytics solution is not as challenging as it may appear. The benefits are obvious, and by considering a few key points before you begin, you will have a solid foundation upon which to build.
Embedding of the shelf available Business Intelligence solutions like Tableau has limits but it offers a variable alternative to in-house solutions. We would recommend that you evaluate embedded analytics before you design and build your own solution. Tableau JavaScript API and Tableau Server offer plenty of flexibility.
If you need help with your tableau embedded analytics, data visualization services, or data engineering consulting get in touch!


![AWS Security Incident Response Plan [Practical Guide]](/uploads/aws-security-incident-response-plan.png)

![Incident Response Plan Template For Startup [SM, MD, XL]](/uploads/incident-response-plan-template.png)