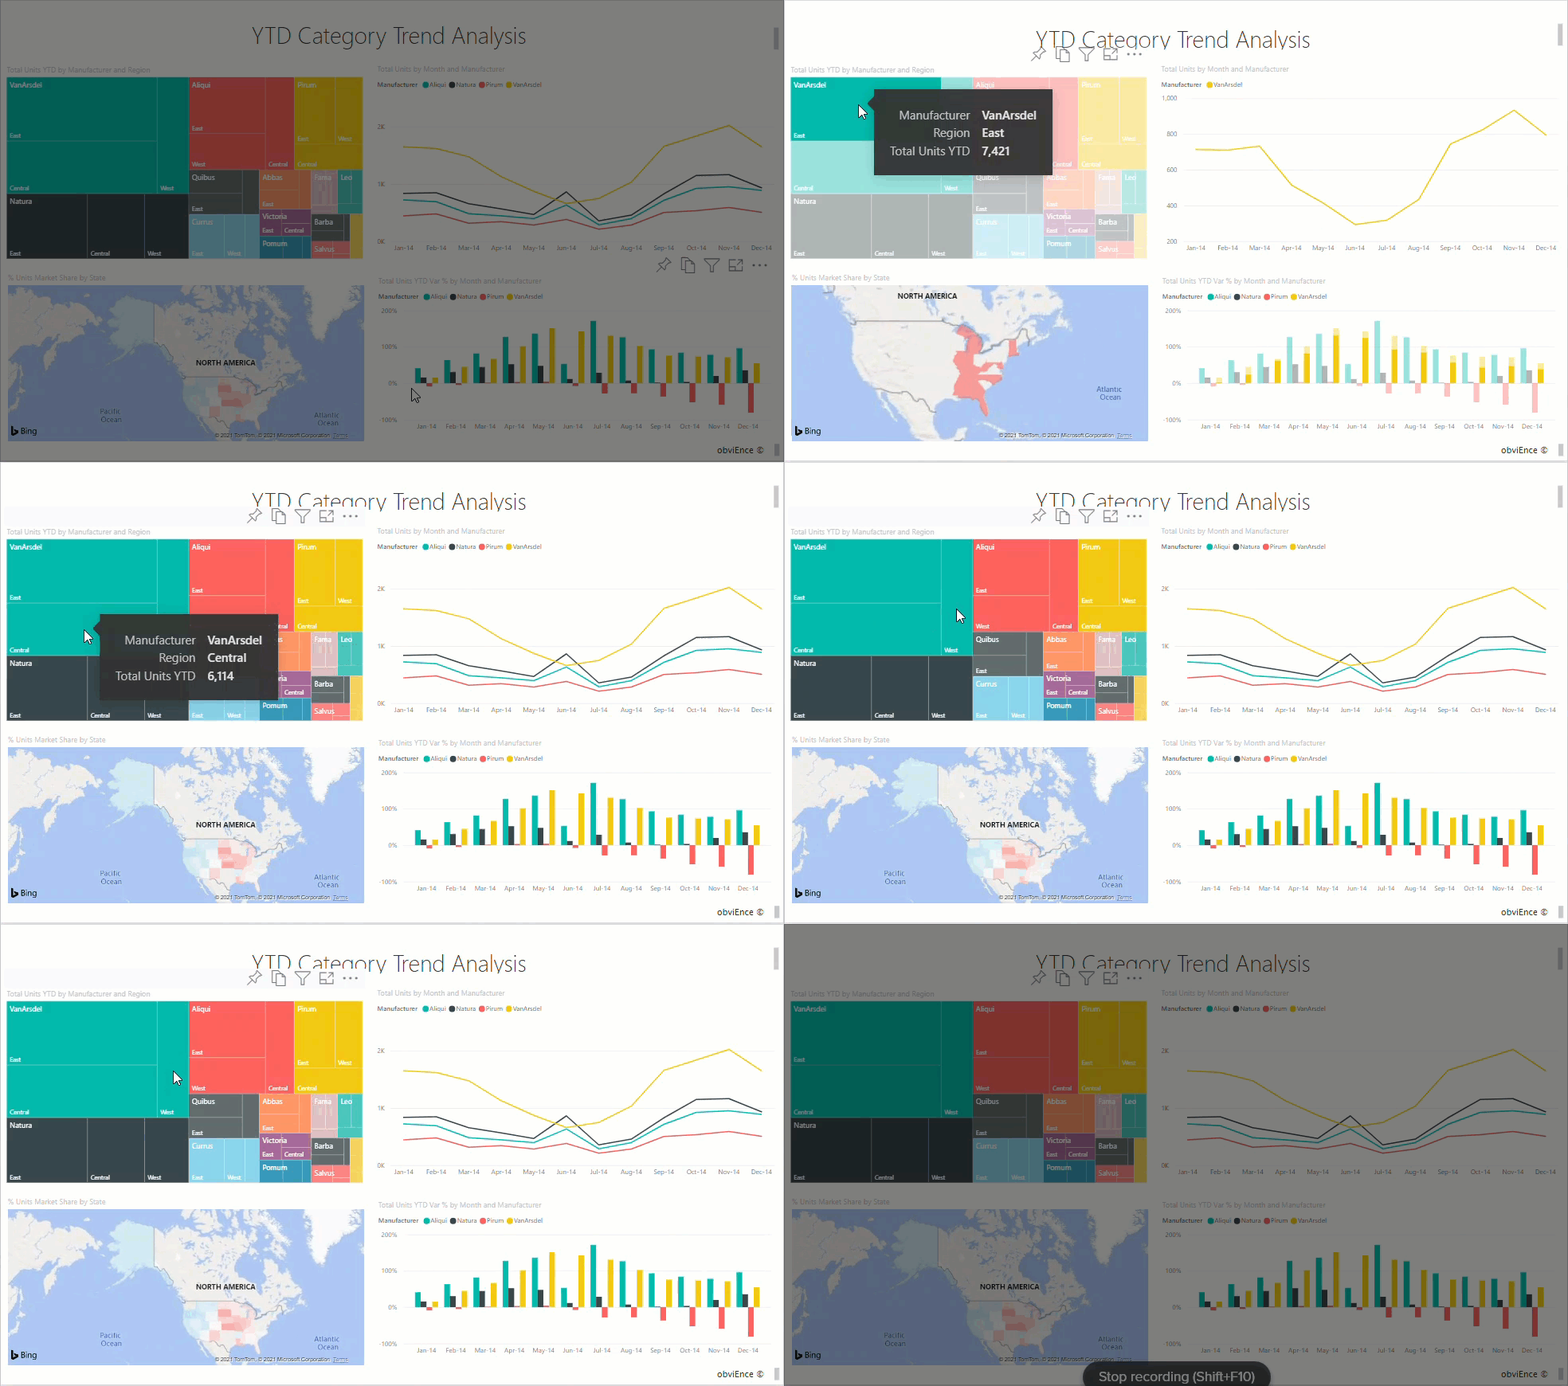
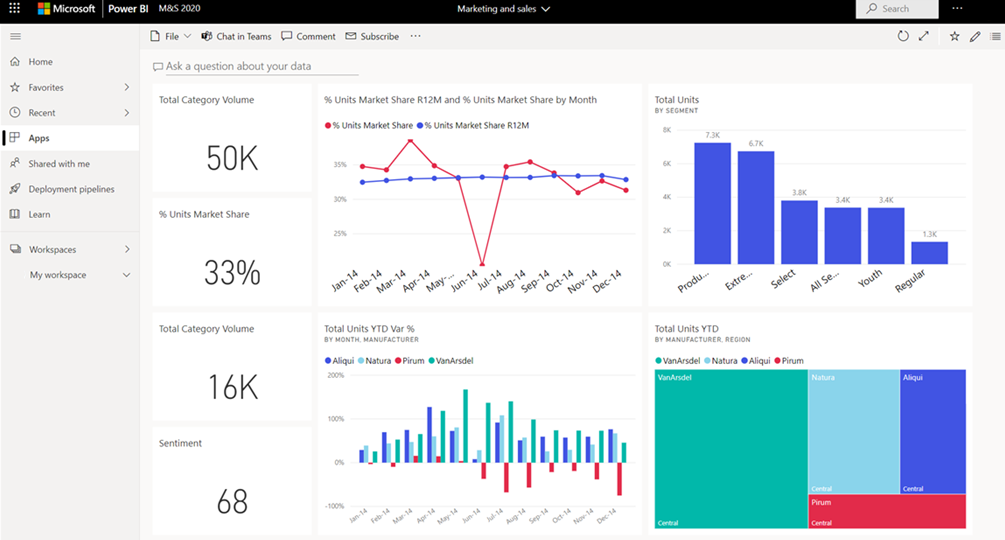
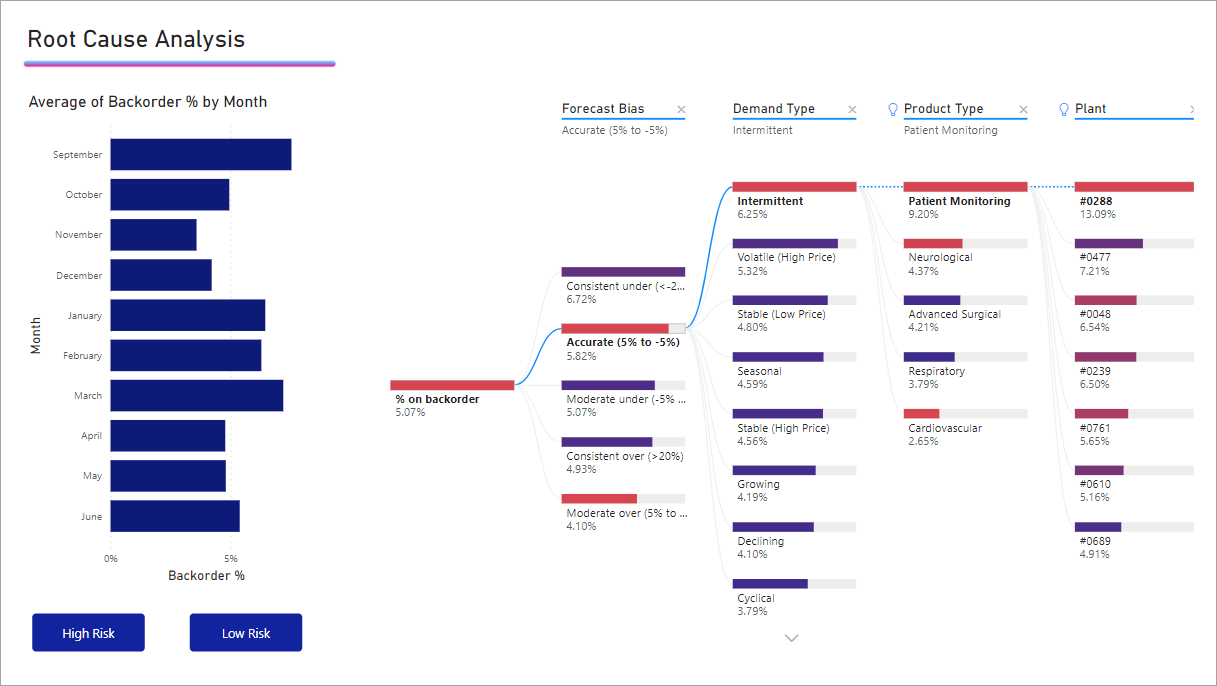
Implement a powerful interactive dashboard to advance your analytics and insight discovery capabilities.
Meet with a Power BI consultant to talk about your data analytics needs. Start journey to fully integrated component BI for everyday company workflows.
Implementing or upgrading an enterprise data warehouse is one of the most important projects your business will embark on. Leverage our data lake architecture blueprints.
Become a data-driven organization with the meaningful insights required to make business decisions immediately.
Become a data-driven organization with the meaningful insights required to make data-driven business decisions.
We help you throughout your data journey to empower users at every level of your organization to use data to improve, hone, and innovate.
Automate complex data management and data analytics efforts to access data faster to drive your critical business decisions with data.
Unlock the full potential of the data visualization. We are experienced in implementing interactive dashboards.
Become a data-driven organization with the advanced analytics and insights required to make data-driven decisions.
We partner with entrepreneurs, business and technology leaders who are after software driven innovation in the products, processes and business ventures they undertake to bring to life.
"SoftKraft have proven across several technologies they are way ahead of the curve. They are well versed in IoT, big data, and machine learning. The team impressed us with their ability to speak at the business strategy level."
CTO at TMC Group, USA
"SoftKraft has been a very reliable partner for us. They took over our system infrastructure in a short time and managed to handle it in a professional and reliable way. We would be happy to work with SoftKraft again."
VP Engineering at ZenGuard, DE
"The team have been excellent to work with as we develop ML capabilities for our platform. They are harnessing the latest technology in ML and Ai for our product goals."
Founder and CEO of Neutopia, AU
Data visualization success is in user engagement and actionable insights. A good place to start is by looking at the reports and dashboards that end users are currently using and mapping those to the data visualization services.
General characteristics of good data visualization are that they are:
As a provider of data visualization services, we assist you throughout your data journey by implementing an in-depth research and development plan to determine the best way for answering your questions and achieving your vision at the highest level.
Our approach to data visualization services is as follows:
The basic idea of data visualization is to make the most important data easier to see. The usage of data visualization tools and big data platforms has revolutionized the procedures. Here are some of the best practices in data visualization: