Did you know that businesses lose an average of 20-30% of their revenue due to inefficient business processes? That's a lot of money left on the table. One of the best ways to get control of this lost revenue is through business process mapping. With the right business process maps, you can identify inefficiencies and fix them, fast.
In this article, we'll share 6 business process mapping examples that you can use to create your own business process maps, take back control of your business operations and boost your bottom line.
What is a business process map?
A business process map is a graphical representation of the steps involved in a business process, illustrating how activities and tasks are linked together. Process mapping can be used to document, analyze and improve processes. It encourages collaboration within an organization, allowing everyone to share ideas based on shared understanding of the processes.
Benefits of business process mapping
By creating a visual representation of a business process, we can identify areas of inefficiency or risk and be able to make improvements. Here are some of the benefits of business process mapping:
- Improved efficiency: Business process mapping helps to identify inefficiencies, which can be replaced with streamlined workflows and automated processes that can help teams save time and money.
- Improved clarity: Business process mapping provides a clear structure and visual representation of processes and steps, making it easier for teams to understand and follow processes consistently.
- Improved collaboration: Business process mapping encourages
- collaboration between team members, allowing them to share ideas and create a unified understanding of the process.
- Improved quality: Business process mapping helps to identify potential areas of risk and can be used to verify and control the quality of products and services.
By taking advantage of these benefits, business leaders can streamline operations and increase their organization productivity.
6 truly essential business process mapping examples
One of the best ways to get started with business process mapping is to look at real examples. In this way you can evaluate the type of process map that’s best for your own processes and pick up some best practices along the way. So, let’s get started!
Process flowchart
When you think of a business process map, you probably picture something like what you see below. This is called a process flowchart - or sometimes a flow process chart. It’s exactly what it sounds like: a flowchart that visualizes a process. This is one of the simplest types of business process maps and is ideal for teams who are just getting started with mapping their business processes.
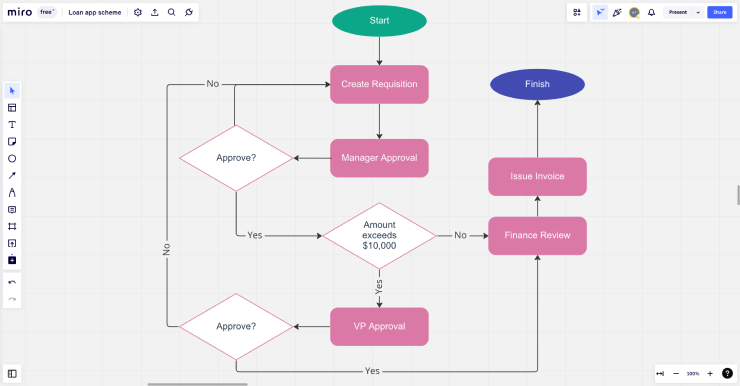
As you can see, the simple business process map above is mapping the purchase requisition process, starting from when the requisition is created, then following it through until the invoice is issued. In this case, it’s a relatively simple process, with just a few decision points, notated by the diamond shapes.
A flow process chart like this one maps out the sequence of activities, decisions, and tasks that must occur for the process to be completed. Different colors and shapes help make the flowchart easier to understand.
Because of their relative simplicity, process flowcharts that are used to model simple or relatively short processes are usually intuitive to read and understand. However, if the process is complex, requiring a lot of decision points or steps, it can quickly become hard to read. It’s at this point that you may consider using another type of business process mapping (like some of the options we’ll outline below!).
When to use it:
A process flowchart is an appropriate business process mapping strategy for relatively simple business processes. It can also be useful for documenting processes at a high-level, which are then expanded on in separate, more detailed, process maps or documentation. It can be a good business process mapping strategy for processes such as:
- Purchase requisition
- Customer returns
- Content review and approval
Why it works:
- Highlights the major process steps that can be then expanded on in other documentation.
- Simplified process map structure makes it intuitive to read and understand.
- Helps to quickly communicate the process to all stakeholders, regardless of their familiarity with process maps.
Data flow diagram
A data flow diagram is a type of flowchart that visualizes the flow of data throughout a process. It is similar to the process flowchart we just looked at, however, it also specifically notes how data flows between steps. Specifically, it is used to help identify where data is being collected, how it is being processed, and where it is being stored during a particular business process.

For example, in this map above, we can see how data flows between systems within a habit tracker app. This could provide visibility into potential data integration issues or security vulnerabilities.
This kind of business process map is great for teams who are looking to identify potential areas of improvement, inefficiencies, and potential data security risks. It offers a nice balance of simplicity and detail, making it an accessible choice for teams less experienced with business process mapping.
When to use it:
Data flow diagrams are most useful when a business needs to map out the flow of data between and within processes. They are especially useful when the organization needs to identify data sources and destinations, detect bottlenecks or performance issues, or establish a baseline for improvement. It can be a good business process mapping strategy for processes such as:
- User account creation
- Inventory management process
- Accounting and billing management
Why it works:
- Provides a visual representation of data flows and their dependencies.
- Creates a clearer understanding of the data sources and their uses.
- Helps to identify potential areas of improvement and inefficiency.
- Makes it easier to optimize data flows and systems in existing processes.
Swimlane diagram
If you’re looking to level up your business process mapping, a swimlane diagram is a great choice. It takes the core fundamentals of a process flowchart and organizes them into swimlanes. These swimlanes can be both horizontal and vertical. In the example below, you’ll see two horizontal swimlanes that divide the two owners of the process. You’ll also see three vertical swimlanes that divide up the larger process into three stages
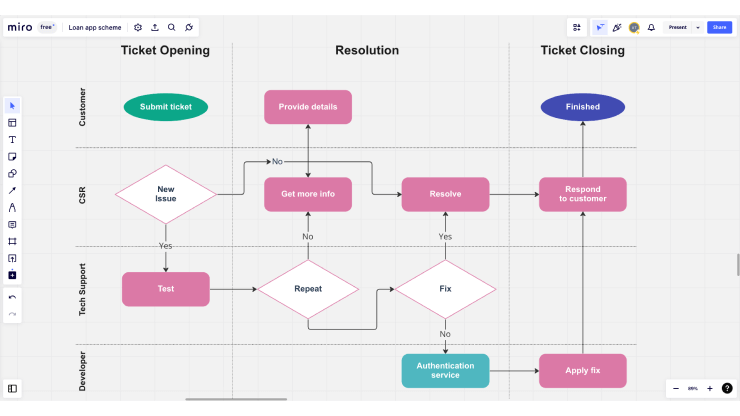
A swimlane diagram helps to provide clarity and structure to a process, as well as identify areas of responsibility. It’s a great way to take a simple process flowchart and organize it in a way that allows you to see inefficiencies or gaps in ownership more clearly.
When to use it:
A swimlane diagram is an appropriate type of business process modeling when a process involves multiple departments, teams, or individuals. It is a useful tool to represent the processes and activities and how they interact with each other. It can be a good business process mapping strategy for processes such as:
- Cross-functional product development
- Marketing campaign design and approval
- Onboarding new employees
Why it works:
- Helps to visualize the distribution of tasks and responsibilities among different teams.
- Creates a clearer representation of the process by separating activities into logical categories.
- Enables detailed analysis and process improvement.
- Makes it easier to identify areas of overlap and duplication of effort in the current process.
BPMN diagram
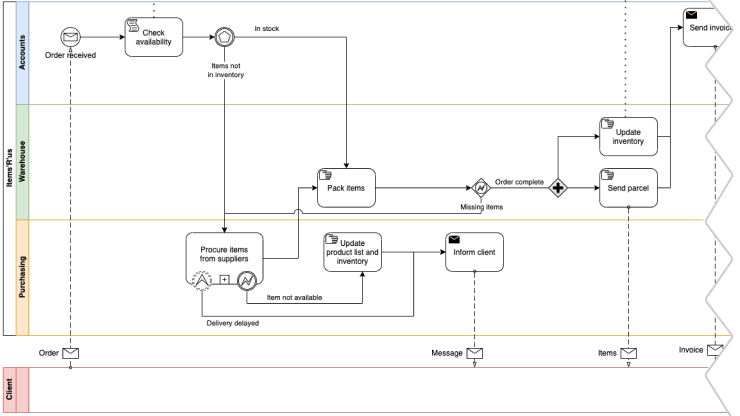
As we have seen, a swimlane diagram provides a great way to organize a business process into steps or owners (i.e. lanes). A business process model diagram (BPMN) also makes use of lanes to organize complex processes, however instead of horizontal and vertical lanes, you have a single large pool and lanes within it, where each of the lanes is an “actor” in the process.
One of the appeals of BPMN is that it is a standard notation developed by the Object Management Group, so instead of inventing your own business process modeling notation, you use a standard notation that can be easily readable across your industry.
Additionally, because of the inherent structure of the lanes in a BPMN, it is great for mapping processes in a high level of detail. You can capture details of an entire process such as process step owners, wait time, data movement, and more, all within one single map. As you add more details to your BPMN, you’ll find that it can become very complex, but still quite easy to read, like the example below.
When to use it:
BPMN is a good fit for processes with many steps, as it allows users to model complex workflows with a variety of activities. It is especially helpful when there are complicated interactions between different roles and systems. It can be a good business process mapping strategy for processes such as:
- Manufacturing processes
- Hardware and software testing
- Product development
- Order fulfillment
Why it works:
- Provides a standard graphical representation of business processes that can be understood by both technical and non-technical personnel.
- Can be used to identify potential bottlenecks in a process, allowing for more efficient operations.
- Easily integrated with other software, such as workflow automation tools, allowing for easier implementation of process changes.
Value stream map
Now that we’ve looked at some traditional business process mapping examples, let’s turn to one that’s a bit more specific to teams who are looking to eliminate waste or inefficiencies in their processes.
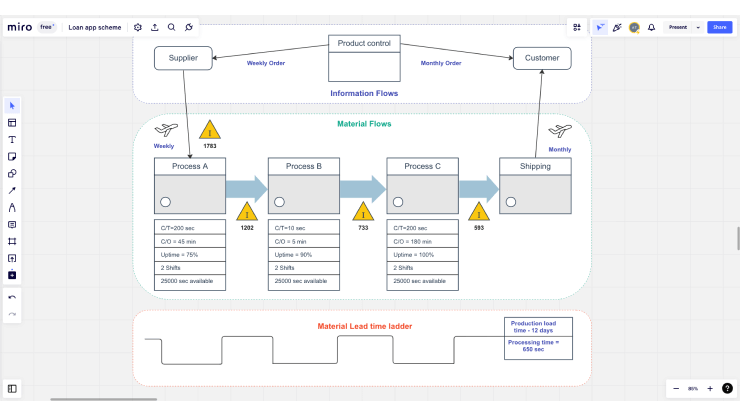
A value stream map is a type of flowchart that visualizes the entire value stream of a process. It can be used to create a “lean” improvement strategy. It is also used to identify areas that can be automated or improved in order to increase the process efficiency. Instead of lanes that divide up the process into stages or process owners, we have three sections that help to organize the chart: Information Flows, Material Flows, and Lead Time.
In the Information Flows at the top of the example below we see how the information about the order flows from the production control to the supplier, which then triggers the process to start. As we move through the various processes, we document the lead times in the bottom section. Using this kind of map is a helpful business process management strategy for teams who want to visualize how materials and information flow throughout a process as well as look for inefficiencies in their process by tracking the lead times in between steps.
When to use it:
A value stream flow chart should be used when a team’s business process management initiative is aiming to identify and eliminate waste in their process. Additionally, it can be used to identify the value-add activities, non-value-add activities, and delays in order to optimize the process. It can be a good business process mapping strategy for processes such as:
- Supply chain processes
- Prototyping processes
- Product and service delivery
Why it works:
- Establishes a visual representation of the entire value stream of a business.
- Helps to identify areas of waste and inefficiency.
- Provides insights into customer value and how it can be improved.
- Makes it easier to adjust and optimize the workflow.
SIPOC flowchart
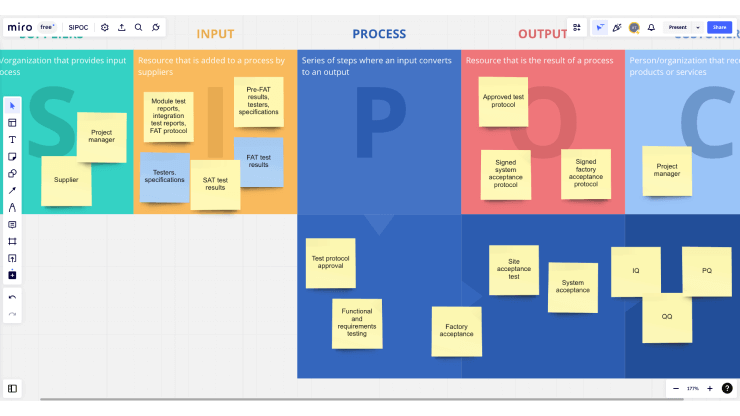
A SIPOC flowchart is quite different from the other business process mapping examples we have looked at so far. SIPOC stands for Suppliers, Inputs, Process, Outputs, and Customers. It is a tool used in business process mapping to identify the major elements of a business process. It can be used on its own or in conjunction with one of the other types of process maps we have looked at above.
In fact, using a SIPOC can be a great way to kick off a business process mapping project as it can serve to help a team brainstorm all of the relevant elements of a particular process before they start using business process mapping software to document their process.
When to use it:
A SIPOC flowchart is especially suitable for identifying and analyzing the inputs and outputs of a given process, and can be used as a way to brainstorm all of the elements of a process that can then be transformed into a more formal business process map or flowchart. It can be a good business process mapping strategy for processes such as:
- Customer service
- Order fulfillment
- Financial reporting
- Product development
Why it works:
- Uses a collaborative approach to identify the suppliers, inputs, process, outputs and customers of a process.
- Enhances communication between stakeholders by providing a low-stakes means of gathering input.
- Helps teams to “brain dump” all of the relevant info before spending time on a more formal business process map.
Tips to streamline business process mapping
Now that we’ve looked at 6 real business process mapping examples, let’s talk about a few ways you can streamline the process of creating your own process maps:
Use industry-standard symbols and notations
Industry-standard business process mapping symbols and notations provide a common language that makes it easier to understand the map. Common symbols and notations used in business process maps include:
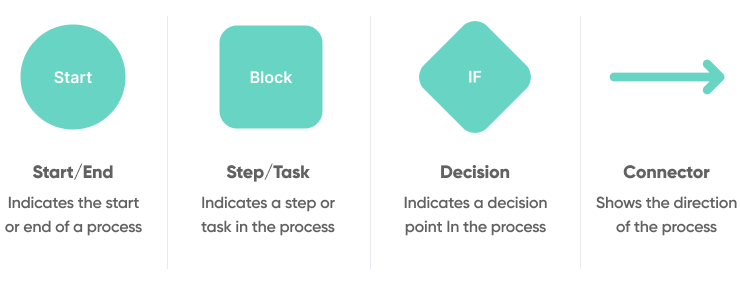
By using industry-standard symbols and notations, businesses can ensure that everyone involved in the business process mapping process understands the process in the same way.
Choose the right business process mapping tool
A good business process mapping tool should allow users to easily create and modify diagrams, collaborate with others, and track progress in real-time. Which one should you choose? It depends on what you are looking for:
- Miro is a great tool for creating collaborative business process maps. It is easy to use and provides a wide range of features such as sticky notes, boards, and whiteboards. It is ideal for teams that need to collaborate on mapping out a process and enjoy a high degree of flexibility, as it allows multiple people to work on the map at the same time.
- Lucidchart is a great option for creating business process maps quickly. It offers a drag-and-drop interface and an array of templates, making it easier to create visual diagrams. It is well suited for businesses that need to quickly create process maps or need to make changes easily.
- Draw.io is a great tool for creating complex business process maps. It offers a wide range of tools and features that allow you to create detailed diagrams. It is ideal for businesses that need to create detailed diagrams with multiple layers of complexity.
Know what your business process KPIs are
Knowing your business KPIs (key performance indicators) before you map business processes is important because it allows you to set meaningful and achievable goals for each process.
Without this information, it would be difficult to ensure that all your efforts to improve business processes are directed in a way that will lead to the desired outcomes. Depending on the process, you may have one or more of the following KPIs:
- On-time completion rate - The percentage of processes that are completed within the expected timeframe.
- Error rate - The percentage of processes that have errors or do not meet the required standards.
- Throughput - The total number of processes that have been completed in a given period of time.
- Resource utilization rate - The percentage of resources that are being used for a particular process.
- Cost savings - The amount of money saved by using a particular process.
- Customer satisfaction - The degree to which customers are satisfied with the outcome of a particular process.
- Quality - The degree to which processes are meeting the required standards and specifications.
- Profitability - A measure of the amount of profits generated by a business process relative to its cost of operation.
- Cycle time - A measure of the amount of time it takes to complete the entire process from start to finish.
Conclusion
Business process mapping is an essential tool for any business looking to identify and eliminate inefficiencies and reduce operational costs. By using some of the business process mapping examples outlined in this article, businesses can quickly create their own maps to visualize their processes, identify areas of improvement, and optimize their operations.
If you're looking for a business software development company to help you optimize your business processes with custom software, don’t hesitate to reach out for a consultation. With our custom business software development services you can accelerate business growth, streamline processes, and boost your bottom line.


