

Predictive Analytics in Finance: 10 High-Value Use Cases
Quick Answer: Predictive analytics in finance estimates a future outcome—default, fraud, churn, liquidity, or volatility—from historical transactions, customer events, and market data. Production value appears when a score improves an owned decision under explicit controls: governed Python/AWS pipelines, a policy layer separate from the model, explainability, drift monitoring, human review, and a business baseline such as fraud loss or approval turnaround.
For a fintech CTO, head of engineering, or risk leader, the decision is not whether to adopt machine learning but which use case justifies the data platform, MLOps, and compliance overhead first. Fraud triage, credit decision support, and cash or collections forecasting usually win when labels, lineage, and monitoring already exist—or when a streaming or warehouse foundation makes them feasible within one quarter.
- What is predictive analytics in finance, and where does it fit?
- What controls are required before a financial model goes live?
- Which use case should a fintech or bank start with?
- Which 10 predictive analytics use cases create value in finance?
- Payment, application, and account-takeover fraud prediction
- Credit risk assessment at origination
- Credit default and early-warning prediction
- Earnings and cash-flow forecasting
- Customer attrition and lifetime-value prediction
- Customer segmentation and next-best-action prediction
- Audit prioritization and compliance-risk detection
- Portfolio risk and rebalancing signals
- Market volatility and liquidity forecasting
- Macroeconomic nowcasting and stress scenarios
- What SoftKraft delivery evidence supports these patterns?
- How should a CTO design a predictive analytics platform for finance?
- What should leaders measure: model quality or business value?
- What should a fintech or bank CTO prioritize next?
- Sources and further reading
What is predictive analytics in finance, and where does it fit?
Predictive analytics estimates a probability, value, class, or time-series distribution from past observations. In finance, the output can be a probability of default (PD), fraud-risk score, churn propensity, liquidity forecast, or volatility interval. It is a decision input, not a guarantee.
A production platform starts with governed data, not with a notebook. Typical components are source systems and consented open-banking feeds, a validated feature pipeline, a versioned model endpoint, a decision-policy layer, and an audit trail. Python is common for feature engineering and validation; Amazon S3, Amazon Kinesis, Amazon SageMaker, AWS Glue, and Amazon CloudWatch can separate storage, streaming, training, deployment, and observability.
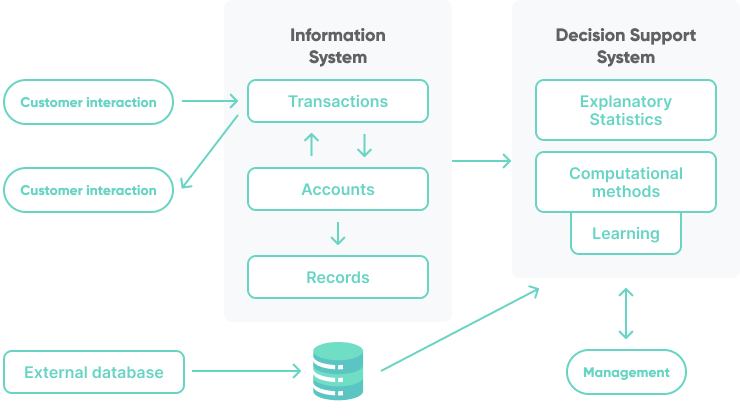
Predictive AI scores, forecasts, ranks, or classifies structured and time-series data. Generative AI creates or summarizes content. Both can work together when an LLM explains an approved risk signal to an analyst, but the score, decision policy, and evidence must remain traceable. See Generative AI vs Predictive AI: 7 Key Distinctions.
What controls are required before a financial model goes live?
Define the supported decision, accountable business owner, accepted error rates, escalation path, and financial baseline before any model reaches production. Document source-to-feature lineage, data-quality thresholds, retention, access controls, and training-serving consistency. For credit, AML, fraud, and other high-impact decisions, test appropriate customer segments, document excluded variables and proxies, and retain reason codes that satisfy adverse-action and audit requirements. The European Banking Authority’s report on machine learning for IRB models similarly stresses the trade-off between predictive performance, explainability, and model understanding.
Monitor more than accuracy: calibration, false-positive and false-negative rates, population stability index (PSI), feature drift, latency, uptime, manual overrides, and realized financial impact. The NIST AI RMF provides a practical GOVERN, MAP, MEASURE, and MANAGE framework. In the EU, controls should be mapped to DORA, GDPR, AML, and applicable model-risk obligations.
Which use case should a fintech or bank start with?
In practice, the best first use case has a clear owner, reliable outcome labels, enough historical examples, and a measurable cost of error. For product CTOs, heads of engineering, and risk or ops leaders in fintech or financial software, the practical first wins are fraud triage, credit decision support, and cash or collections forecasting. Macro nowcasting and market-microstructure models usually belong later, once labels, lineage, and monitoring already work.
| Start here if… | Use case | Why it wins first |
|---|---|---|
| You process payments, onboarding, or account changes at volume | Fraud and account-takeover scoring | Clear labels, fast feedback loop, direct loss and review-cost metrics |
| You underwrite or price credit | Origination credit risk + early-warning monitoring | Existing PD/LGD language, reason-code needs, and underwriting owners |
| Treasury or finance ops still reconcile spreadsheets | Cash-flow and collections forecasting | Ledger and invoice labels exist; value is cycle time and forecast error |
| Retention or product teams own a defined intervention | Churn / next-best-action | Only after you can run a control group; score alone is not ROI |
| You lack clean features or event contracts | Data platform work before a new model | Streaming schemas, warehouse sync, and validated bank files unlock every later model |
Which 10 predictive analytics use cases create value in finance?
The list below follows the same priority as the first-win table: start with fraud, credit, and cash; treat market and macro models as later waves. Each use case names the decision, typical inputs, and what to measure.
Payment, application, and account-takeover fraud prediction
Combine supervised classification for known fraud patterns with anomaly detection and graph features for new networks. Stream payment events through Kafka or Amazon Kinesis, enrich device and account features, score through a versioned endpoint, and route uncertain cases to review.
Streaming reliability is the foundation. SoftKraft’s Kafka consulting for Paysolut, a white-label banking and payments platform, focused on cluster stabilization, storage automation, and schema-based event management—the prerequisites for low-latency scoring and replayable fraud features. AWS’s payment-fraud prevention guidance illustrates the corresponding pattern: streaming transaction data, ML risk scoring, and an escalation or notification workflow.
- Inputs: Payment events, device and account attributes, behavioural features, and confirmed fraud labels.
- Decision: Approve, decline, step up authentication, or route the transaction to manual review.
- Measure: Fraud loss prevented, false-positive review rate, median decision latency, and chargeback or ATO recovery.
Credit risk assessment at origination
Estimate PD, loss given default (LGD), and exposure at default (EAD) to support underwriting and pricing. Separate ingestion, feature engineering, scoring, decision rules, and adverse-action explanations. Revalidate calibration and segment performance as borrower behavior and economic conditions change.
SoftKraft’s peer-to-peer fintech lending platform illustrates the product surface these models must serve: multi-step borrower qualification, credit-score visibility, investor risk-profile matching, encrypted sensitive data, and AWS-hosted Python/Django workflows. The case study documents the lending and investment system—not a proprietary PD model metric—but shows why scoring must sit behind policy, reason codes, and secure document handling rather than inside a UI alone.
- Inputs: Verified application data, repayment history, permitted account data, and policy-defined affordability features.
- Decision: Approve, decline, price, set a credit limit, or request additional evidence.
- Measure: Approval turnaround, default rate versus expected PD by segment, and adverse-action explanation completeness.
Credit default and early-warning prediction
Identify deterioration after origination—before a missed payment or covenant breach—using payment behavior, account utilization, cash-flow changes, and permitted verified data. This is the monitoring twin of use case 2: origination decides who enters the book; early warning decides who needs a playbook now.
- Inputs: Payment behaviour, account utilisation, cash-flow changes, covenant data, and permitted verified data.
- Decision: Trigger manual review, hardship support, revised limits, or collections—not a score shown without an owner.
- Measure: Lead time before default, cure rate after intervention, and loss severity versus a rules-only baseline.
Earnings and cash-flow forecasting
Forecast revenue, working capital, collections, and cash positions from ledger entries, invoices, payment behavior, and seasonality. Hierarchical time-series models and probabilistic forecasts can provide a range and driver breakdown for treasury decisions.
Clean bank-file ingestion is often the missing prerequisite. SoftKraft’s work automating BAI balance-report conversion and validation shows the operational pattern: remove manual CSV conversion, validate inputs and outputs, and produce a unified export that analytics teams can trust. Without that layer, cash models inherit reconciliation noise.
- Inputs: Ledger entries, invoices, payment behaviour, collections history, and seasonality.
- Decision: Allocate cash, prioritise collections, adjust funding, or refresh a liquidity forecast.
- Measure: Forecast bias and MAPE by entity, days of cash buffer accuracy, and hours removed from month-end prep.
Customer attrition and lifetime-value prediction
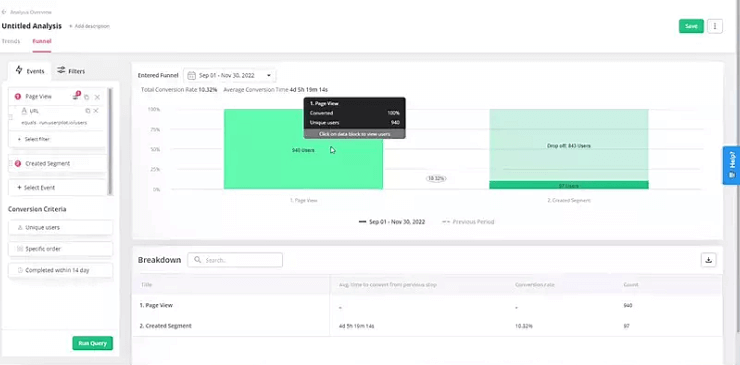
Detect churn risk from product usage, payment patterns, support events, and consented engagement data. Match the intervention to the likely cause. Measure incremental retention or margin against a control group; a high propensity score alone is not ROI.
- Inputs: Product usage, payment patterns, support events, consented engagement data, and historical retention outcomes.
- Decision: Suppress contact, prioritise servicing, offer retention support, or test a product intervention.
- Measure: Incremental retained margin, contact cost, and offer take-up versus holdout—not propensity AUC in isolation.
Customer segmentation and next-best-action prediction
Group customers by expected behavior rather than static demographics alone. Support consent-aware offers, servicing priorities, or product education. Prevent sensitive attributes and proxy variables from producing unfair treatment, and retain the policy that turned a score into a customer-facing action. ESMA identifies algorithmic bias, data-quality, privacy, and security risks when investment firms use AI.
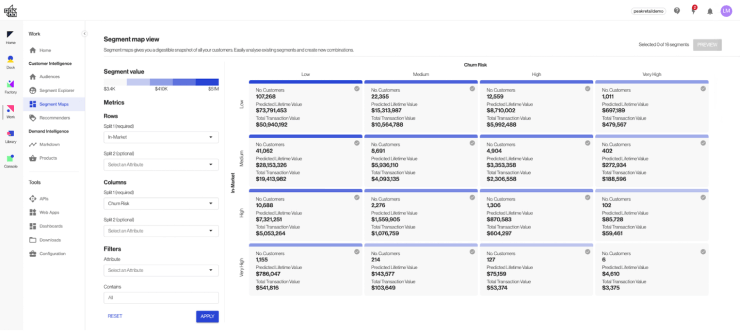
Analytical warehouses make these scores operable. SoftKraft’s PostgreSQL OLTP to Amazon Redshift OLAP sync is a concrete pattern: keep the transactional schema intact, move analytics load to Redshift via S3 and IAM-controlled jobs, and give product or risk teams queryable features without stressing the ledger.
- Inputs: Consent-filtered product, transaction, service, and engagement data.
- Decision: Select an eligible offer, servicing priority, educational message, or no action.
- Measure: Incremental margin or retention versus holdout, eligibility-policy compliance, and disparate-impact checks. ### 7. Audit prioritization and compliance-risk detection
Rank cases, transactions, controls, or third parties by their likelihood of requiring review.
- Inputs: Historical findings, control failures, transaction anomalies, and third-party risk attributes.
- Decision: Queue order and sampling depth for auditors or compliance analysts.
- Measure: Hit rate of prioritized reviews, average time-to-finding, and false-alarm burden—plus a full audit trail of score, policy, analyst decision, and outcome.
Portfolio risk and rebalancing signals
Estimate factor exposure, drawdown probability, liquidity needs, and mandate-limit breaches. These signals prioritize research and rebalancing; they do not replace suitability rules, risk limits, or human accountability.
Investment workflows often need faster feature pipelines before a new risk model. For a private-equity real-estate firm, SoftKraft rebuilt ETL on Apache Spark so analysts could reach processed market data several times faster and left the architecture ready for machine-learning milestones. A related Kafka redesign cut infrastructure cost by close to 90% while shrinking report generation time by an order of magnitude—see efficient data processing for real estate. That is not a published portfolio-alpha case study; it is evidence that predictive work stalls without scalable, cost-controlled features.
- Inputs: Positions, market prices, factor exposures, liquidity data, mandate limits, and scenario assumptions.
- Decision: Prioritise research, propose rebalancing, raise a limit alert, or request portfolio-manager review.
- Measure: Limit-breach lead time, liquidity forecast error, drawdown calibration, and decision turnaround time. ### 9. Market volatility and liquidity forecasting
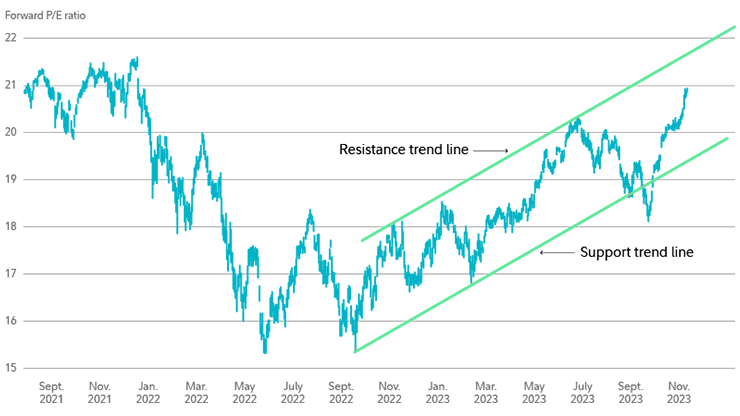
Estimate distributional risk for pricing, hedging, limits, and collateral planning. GARCH-family models provide transparent baselines. More complex models must prove additional value through time-aware backtests, realistic transaction costs, and stress-period tests.
- Inputs: Market prices, returns, implied volatility, liquidity indicators, and stress scenarios.
- Decision: Adjust hedges, collateral, trading limits, or escalation priority.
- Measure: Calibration of predicted intervals, limit-breach prediction lead time, and P&L attribution after costs—not in-sample R² alone.
Macroeconomic nowcasting and stress scenarios
Update GDP, inflation, unemployment, or sector-demand assumptions before monthly or quarterly releases complete.
- Inputs: Official releases, market prices, and high-frequency operational signals from the institution’s own book.
- Decision: Refresh treasury, planning, or stress-test assumptions with forecast intervals—not a single point presented as certainty.
- Measure: Forecast error versus later official data, and whether scenario updates change limit or funding decisions in time.
This is usually a second-wave use case for banks and large treasuries, not the first model for a product fintech.
What SoftKraft delivery evidence supports these patterns?
SoftKraft does not publish confidential model AUCs or client loss curves from regulated books. Where a use case above needs a concrete delivery reference, it links the relevant public case study—Kafka for payments, P2P lending workflows, bank-file automation, warehouse sync, or ML-ready investment data platforms. Treat those as architecture and delivery evidence when scoping a program, not as a substitute for your own labelled outcomes and model validation.
How should a CTO design a predictive analytics platform for finance?
- Ingest and standardize data. Use schema contracts, idempotent ingestion, reconciliation checks, and immutable raw storage. For high-volume events, apply streaming data architecture—the same class of work SoftKraft performed when stabilizing Kafka for a payments platform and when cutting reindexing cost with event-driven consumers.
- Separate transactional and analytical paths. Sync OLTP into a warehouse or lakehouse so scoring and BI do not compete with ledger latency. The Redshift sync pattern in use case 6 is one AWS-native approach; pair it with Python feature jobs and tests.
- Create reproducible features. Version feature definitions and prevent training-serving skew. Pair Python libraries such as Pandas, Polars, scikit-learn, XGBoost, and MLflow with tests, lineage, and access controls. See high-performance Python data pipelines.
- Validate before release. Compare against a simple baseline, backtest by time period, check calibration and segment performance, and require model-approval gates.
- Deploy with policy controls. Separate the model score from the decision policy. Enforce role-based access, encryption, secrets management, retention, and a human-in-the-loop path for exceptions.
- Measure realized ROI. Track fraud loss prevented, manual-review hours avoided, turnaround time, collections recovery, churn reduction versus control, and the cost of false positives with Finance, Risk, Compliance, and Product.
What should leaders measure: model quality or business value?
Both metrics matter. Model quality establishes technical reliability; business metrics establish whether the workflow merits continued investment. Define the baseline, assign an owner for every metric, and review results on a fixed cadence.
The European Central Bank's March 2026 analysis notes that granular data and predictive capabilities can improve credit pricing and risk assessment—useful context for underwriting and early-warning programs. Separately, its May 2026 research bulletin shows that AI architecture itself can shape financial-stability outcomes (for example, reinforcement-learning versus reasoning-based agents behave differently under stress). For a product CTO, the practical takeaway is narrower: treat model choice, decision policy, and monitoring as risk controls, not only as accuracy upgrades.
What should a fintech or bank CTO prioritize next?
Key takeaway: predictive analytics creates value when it improves a specific decision under explicit controls—not when a model ships without an owner or baseline. Start with reliable labels, a responsible business owner, a measurable cost of error, and a feasible path to production data—often fraud, credit, or cash forecasting before exotic market models. Then build the feature pipeline, validation, policy layer, monitoring, and human review around the model.
For LLM workflows, read Generative AI in Finance Services - 10 Proven Use Cases. If you need a delivery partner for regulated financial software, data platforms, or MLOps-ready pipelines, explore our financial software development services or contact SoftKraft to scope the first use case, data contracts, and control boundary.
Sources and further reading
- SoftKraft case studies: P2P fintech lending, Kafka for fintech, bank report automation, Redshift OLTP→OLAP sync, big data ETL for investment decisions, Kafka data-processing redesign.
- European Central Bank: AI and the euro area economy (March 2026).
- European Central Bank: Financial stability in the age of artificial intelligence (May 2026).
- European Banking Authority: Follow-up report on machine learning for IRB models (2023).
- European Union: Digital Operational Resilience Act — Regulation (EU) 2022/2554.
- ESMA: Public Statement on AI and investment services (2024).
- NIST: SP 800-53 Control Overlays for Securing AI Systems concept paper (April 2026).
- AWS: Guidance for Payments Fraud Prevention on AWS.